xiVIEW
xiVIEW is a visual interface to querying crosslink mass spectrometry datasets.

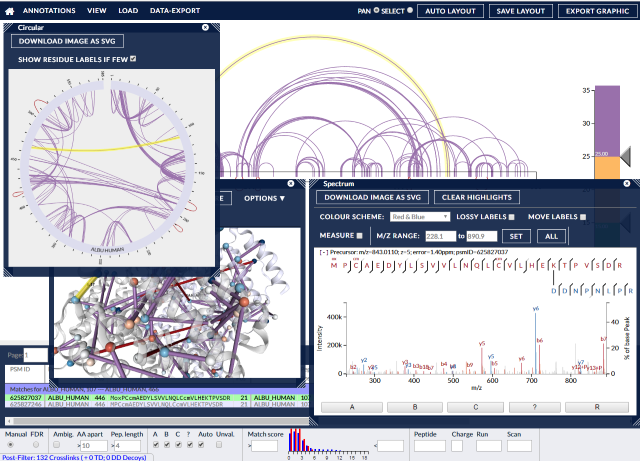
xiVIEW contains many different ways to view crosslink data, from circle plots, protein network views, protein sequence views and tables, to raw spectra and peak views. Data can be filtered and exported, as can images. PDB datasets can be incorporated to give physical context to the crosslinks, enabling 3D and contact map views, with automatic alignment performed between Xi and PDB sequences.
Code is available at RappsilberLab GitHub
Most of the interaction and possibilities present in xiVIEW are best seen in action rather than described in writing. To this end, a number of short videos describing the individual components of xiVIEW have been uploaded to Vimeo and can be accessed at RappsilberLab @ Vimeo
These videos can be divided into several categories:
Introduction
xiVIEW can look like it has an intimidating number of options but most of them are simply different ways of looking at the same set of crosslink data. The workflow is simply that once data is loaded in, some metadata (PDB for distance data) can be imported, views can be displayed, crosslinks can be filtered, and the results exported as text files (CSV) or images (PNG or SVG). This video gives a swift rundown of what’s to be found in different areas of the browser window.
Standard Views
The ‘Standard’ views are those which can be generated from just the data in the loaded search. Two of them – xiNET (the main view) and the Circle view are essentially twists on the same kind of representation. Proteins are drawn as bars (straight or bendy), and crosslinks are drawn between the positions on those bars that they are reckoned to occur at. Immediately it becomes apparent which areas of a protein (and which proteins for multi-protein searches) have the highest density of supported crosslinks. They are both described here in videos that show how they work with signal proteins and in separate videos that show how they work with multiple proteins – which often involve the activation of more display options.
The third view, Selected Protein Info, shows the metadata and sequence connected with a chosen protein. Crosslinks aren’t shown directly but inspecting residues within a sequence shows how many and which crosslinks are associated with a particular residue.
xiNET
Circle
Protein Info
PDB-Enabled Views
There are a number of views in xiVIEW specifically designed to show crosslink data in the context of physical data, including distances and protein crystal structures. These views can be enabled by first loading a PDB data file, either locally or from the Protein Data Bank itself, as the first video here demonstrates.
The three enabled views in order of increasing abstractness are firstly a 3D view, based on Alex Rose’s NGL viewer – http://doi.org/10.1093/nar/gkv402; secondly, a matrix (or contact map) view that shows the distances between two protein chains; and finally one that aggregates all crosslink distances into a bar chart (distogram). The first two overlay crosslinks onto their views, so the crosslinks can be seen in context.
Loading PDB Data
NGL
Matrix
Distogram
Spectra
Spectra are the underlying raw data behind the assertion of a crosslink. When processing a search, the xiSEARCH engine compares spectra against theoretical fragments of a crosslinked peptide(s). Where the comparison is close enough the spectra is deemed a match for a crosslink at a particular position. Here we can see how to access the associated spectra for a crosslink via a table of matches, and then how to interact with the spectrum view itself.
Accessing the Spectrum View
Explaining the Spectrum View
Additional Views
Other views available in xiVIEW include the alignment and legend views.
The alignment view doesn’t show any crosslinks, but does show the computed alignments between the search sequence (the one loaded in with the search) and any uniprot and PDB sequences that are also currently loaded. Uniprot sequences are automatically loaded if there are less than 100 proteins in the search and the accession number for the protein matches a sequence in uniprot’s database.
The legend view shows the current colour scale, with options to swap scales and edit individual colours. It also displays the meaning behind the symbols and markings used in the main (xiNET) and circular views.
The annotation menu allows the placing of highlighted regions within the protein representations that map to identified structures and regions within a protein. Also, there are options to show regions covered by the currently loaded PDB file and to show crosslinkable and digestible residues.
Alignment
Legend
Annotations
Filter
There are two ways to filter data in the interface. One is to use a set of ‘manual’ filters that exclude crosslinks on the basis of metadata such as crosslink separation, crosslink type, and the automatic and manual scores assigned to the matches that support cross links. The second method is to use a false discovery rate cutoff. This requires loading the dataset with decoy data and then a suitable cutoff of real to decoy crosslinks can be requested, ordered by score.
Manual
False Discovery Rate (FDR)
Export
Communicating the results of filtering on a search can be done in two ways. The first is to export data in a CSV file, whether it’s the matches, links or residue aggregates. The second is to export the image of a particular view as it looks with current filtering. These are saved mainly as SVG files to allow use in publication quality figures.
CSV Files
Images
xiVIEW was developed at Edinburgh University under a Wellcome Trust Core Grant: 203149
Developers: Colin Combe, Martin Graham, Lars Kolbowski
xiVIEW uses the following libraries:
| Library | Version | In Component | URL | License Type |
|---|---|---|---|---|
| Jquery | 3.3.1 | History, SearchSubmit, UserGUI | https://github.com/jquery/jquery | MIT |
| Jquery-UI | 1.12.1 | History, SearchSubmit, UserGUI | https://github.com/jquery/jquery-ui | MIT |
| Zepto | 1.2.0 | xiVIEW | https://github.com/madrobby/zepto | MIT |
| DataTables | 1.10.15 | xiSPEC | https://github.com/DataTables/DataTables | MIT |
| MultipleSelect | 1.2.1 | UserGUI, SearchSubmit | https://github.com/wenzhixin/multiple-select | MIT |
| Spin.js | 2.3.2 | UserGUI, xiVIEW | https://github.com/fgnass/spin.js/ | MIT |
| HideShowPassword | 2.0.11 | UserGUI | https://github.com/cloudfour/hideShowPassword | MIT |
| PHPMailer | 5.2.24 | UserGUI | https://github.com/PHPMailer/PHPMailer | LGPL-2.1 |
| BlueImp | 9.18.0 | SearchSubmit, xiSPEC | https://github.com/blueimp/jQuery-File-Upload | MIT |
| University-Domains-List | 1.0.0 | UserGUI | https://github.com/Hipo/university-domains-list | MIT |
| Split.js | 1.3.5 | xiVIEW | https://github.com/nathancahill/Split.js | MIT |
| Backbone | 1.3.3 | xiVIEW, SearchSubmit | https://github.com/jashkenas/backbone | MIT |
| C3 | 0.4.23 + own changes | xiVIEW | https://github.com/c3js/c3 | MIT |
| Cola.js | 3.3.8 | xiVIEW | https://github.com/tgdwyer/WebCola | MIT |
| D3 | 3.5 | xiVIEW, History, UserGUI, SearchSubmit | https://github.com/d3/d3/releases/tag/v3.5.17 | Custom |
| Colorbrewer.js | 2 | xiVIEW | https://github.com/axismaps/colorbrewer/ | Apache 2.0 |
| NGL | 2.0.0-dev33 | xiVIEW | https://github.com/arose/ngl | MIT |
| rgbcolor | 1 | xiVIEW | https://github.com/ariutta/rgb-color | ??? |
| Underscore | 1.9.1 | xiVIEW, History, SearchSubmit, UserGUI | https://github.com/jashkenas/underscore | MIT |
| DynDiv | 1.0rc1 | xiVIEW | https://github.com/Kaworru/dyndiv | MIT |

